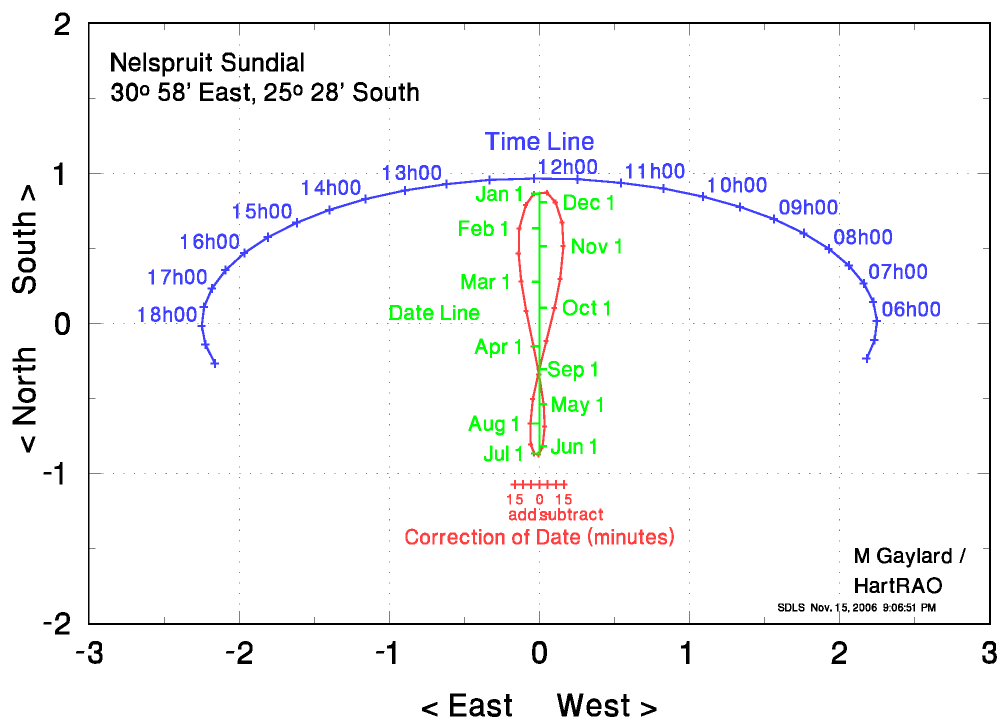
Note that the "squares" on the diagram must look square, ie one unit of length horizontally must equal one unit of length vertically.
The data used to create this sundial are listed below, if you want to make your own large "walk-on" sundial. The columns are:
	Nelspruit
        Time       Xtime       Ytime        date         Xan         Yan        Teqn       XTeqn
       05h00       2.183      -0.235       Jan01      -0.036       0.865      -15.00      -0.164
       05h30       2.235      -0.110       Jan15      -0.091       0.790      -10.00      -0.109
       06h00       2.250       0.016       Feb01      -0.134       0.634       -5.00      -0.055
       06h30       2.225       0.142       Feb15      -0.139       0.465        0.00       0.000
       07h00       2.163       0.266       Mar01      -0.122       0.279        5.00       0.055
       07h30       2.064       0.385       Mar15      -0.089       0.085       10.00       0.109
       08h00       1.929       0.498       Apr01      -0.039      -0.153       15.00       0.164
       08h30       1.762       0.602       Apr15      -0.001      -0.341
       09h00       1.564       0.696       May01       0.029      -0.541
       09h30       1.339       0.777       May15       0.036      -0.688
       10h00       1.092       0.846       Jun01       0.023      -0.819
       10h30       0.826       0.900       Jun15      -0.004      -0.874
       11h00       0.546       0.939       Jul01      -0.035      -0.869
       11h30       0.256       0.961       Jul15      -0.058      -0.805
       12h00      -0.038       0.967       Aug01      -0.060      -0.667
       12h30      -0.331       0.957       Aug15      -0.045      -0.504
       13h00      -0.619       0.930       Sep01       0.000      -0.304
       13h30      -0.896       0.887       Sep15       0.046      -0.117
       14h00      -1.158       0.830       Oct01       0.101       0.105
       14h30      -1.400       0.758       Oct15       0.139       0.295
       15h00      -1.618       0.672       Nov01       0.161       0.515
       15h30      -1.808       0.576       Nov15       0.152       0.672
       16h00      -1.967       0.470       Dec01       0.107       0.809
       16h30      -2.093       0.355       Dec15       0.050       0.872
       17h00      -2.183       0.235                  -0.036       0.865
       17h30      -2.235       0.110
       18h00      -2.250      -0.016
       18h30      -2.225      -0.142
       19h00      -2.163      -0.266