Note that the "squares" on the diagram must look square, ie one unit of length horizontally must equal one unit of length vertically.
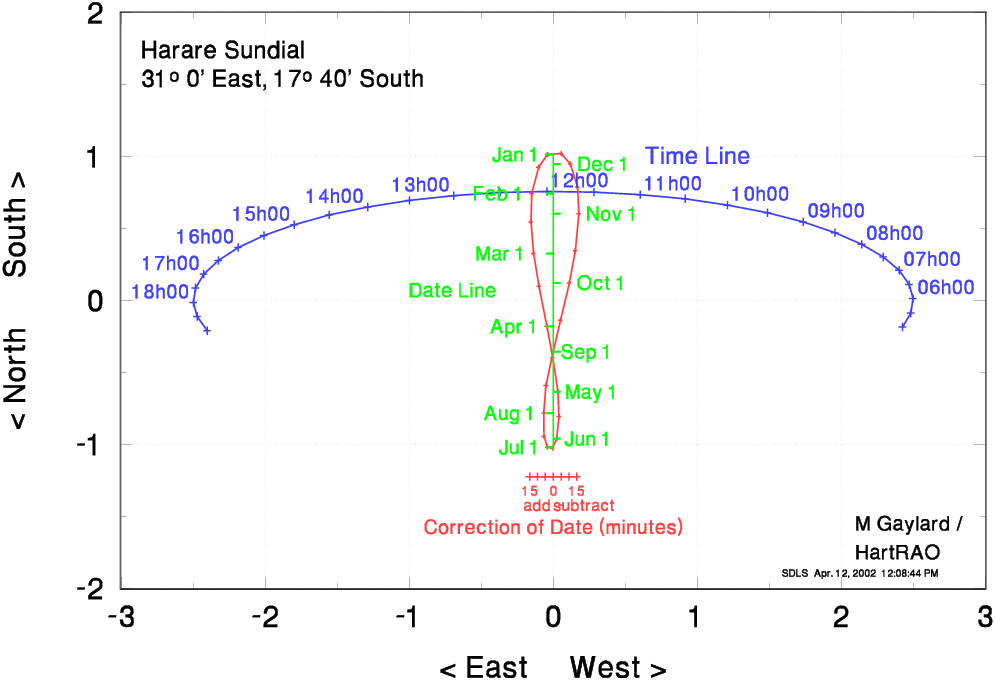
The data used to create this sundial are listed below, if you want to make your own large "walk-on" sundial. The columns are:
       Harare, Zimbabwe
        Time       Xtime       Ytime        date         Xan         Yan        Teqn       XTeqn
       05h00       2.426      -0.184       Jan01      -0.040       1.014      -15.00      -0.164
       05h30       2.484      -0.086       Jan15      -0.101       0.926      -10.00      -0.109
       06h00       2.500       0.013       Feb01      -0.149       0.743       -5.00      -0.055
       06h30       2.473       0.112       Feb15      -0.154       0.546        0.00       0.000
       07h00       2.403       0.209       Mar01      -0.135       0.327        5.00       0.055
       07h30       2.293       0.303       Mar15      -0.099       0.100       10.00       0.109
       08h00       2.143       0.391       Apr01      -0.044      -0.179       15.00       0.164
       08h30       1.957       0.472       Apr15      -0.001      -0.400
       09h00       1.737       0.546       May01       0.033      -0.634
       09h30       1.487       0.610       May15       0.040      -0.807
       10h00       1.212       0.664       Jun01       0.025      -0.961
       10h30       0.916       0.706       Jun15      -0.004      -1.025
       11h00       0.605       0.736       Jul01      -0.039      -1.019
       11h30       0.283       0.754       Jul15      -0.065      -0.944
       12h00      -0.044       0.759       Aug01      -0.067      -0.782
       12h30      -0.370       0.750       Aug15      -0.050      -0.591
       13h00      -0.689       0.729       Sep01       0.000      -0.356
       13h30      -0.997       0.696       Sep15       0.051      -0.137
       14h00      -1.288       0.650       Oct01       0.112       0.123
       14h30      -1.556       0.594       Oct15       0.154       0.346
       15h00      -1.798       0.527       Nov01       0.179       0.604
       15h30      -2.010       0.451       Nov15       0.169       0.788
       16h00      -2.187       0.368       Dec01       0.119       0.949
       16h30      -2.326       0.278       Dec15       0.055       1.022
       17h00      -2.426       0.184                  -0.040       1.014
       17h30      -2.484       0.086
       18h00      -2.500      -0.013
       18h30      -2.473      -0.112
       19h00      -2.403      -0.209